我曾经以为Counter是prometheus中最简单的一种metric,直到我在Grafana中配置counter相关的dashboard之后,才发现自己对于counter的理解有一些偏差。因此这篇博客将会详细的介绍counter的用法。
创建Demo
为了更好的说明,我们需要创建一个简单的demo,用来构建一个简单可控的counter以便prometheus采集。在我之前的一篇博客Spring Boot整合Prometheus中,详细介绍了SpringBoot如何整合prometheus,在这里就不做详细的说明
首先,在pom文件引入Micrometer Prometheus的依赖
<dependency>
    <groupId>io.micrometer</groupId>
    <artifactId>micrometer-registry-prometheus</artifactId>
</dependency>
然后,在application.properties中进行prometheus的相关配置
management.endpoint.prometheus.enabled=true
management.metrics.export.prometheus.enabled=true
之后,在prometheus.yml配置采集路径以及采集间隔
scrape_configs:
 - job_name: prometheus-test
   scrape_interval: 10s
   metrics_path: /actuator/prometheus
   static_configs:
   - targets: ['172.16.22.50:8080']
Counter定义
在prometheus文档中counter的定义如下
A counter is a cumulative metric that represents a single monotonically increasing counter whose value can only increase or be reset to zero on restart
monotonically increasing表示counter的值是单调递增的,cumulative metric表示counter表示的是当前整体的值。
根据上述定义,我们定义一个counter用来记录http请求数
@Component
public class HttpCounterJob {

    private final Counter httpCounter;

    public HttpCounterJob(MeterRegistry meterRegistry){
        httpCounter = meterRegistry.counter("http.processed");
    }

}
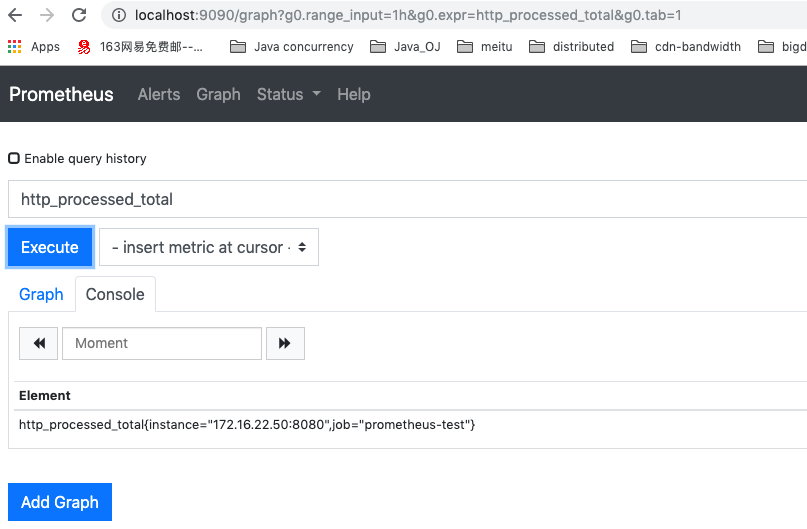
Micrometer会将metric转化为prometheus的metric,我们可以在prometheus中看到一个名为http_processed_total的metric.其中_total是Micrometer 将Counter metric转为prometheus Counter metric的后缀
重启项目之后,我们可以在prometheus graph中看到刚刚定义的counter
为了更好的观察counter的逻辑,我们让counter每隔5秒加1
@Scheduled(fixedDelay = 5000)
public void increase(){
    httpCounter.increment();
}
随着时间counter的值逐渐递增,我们可以看到counter包含从创建之初到当前时刻所有的值。但是在实际应用中,我们可能并不关心这个整体的值,而是增长趋势
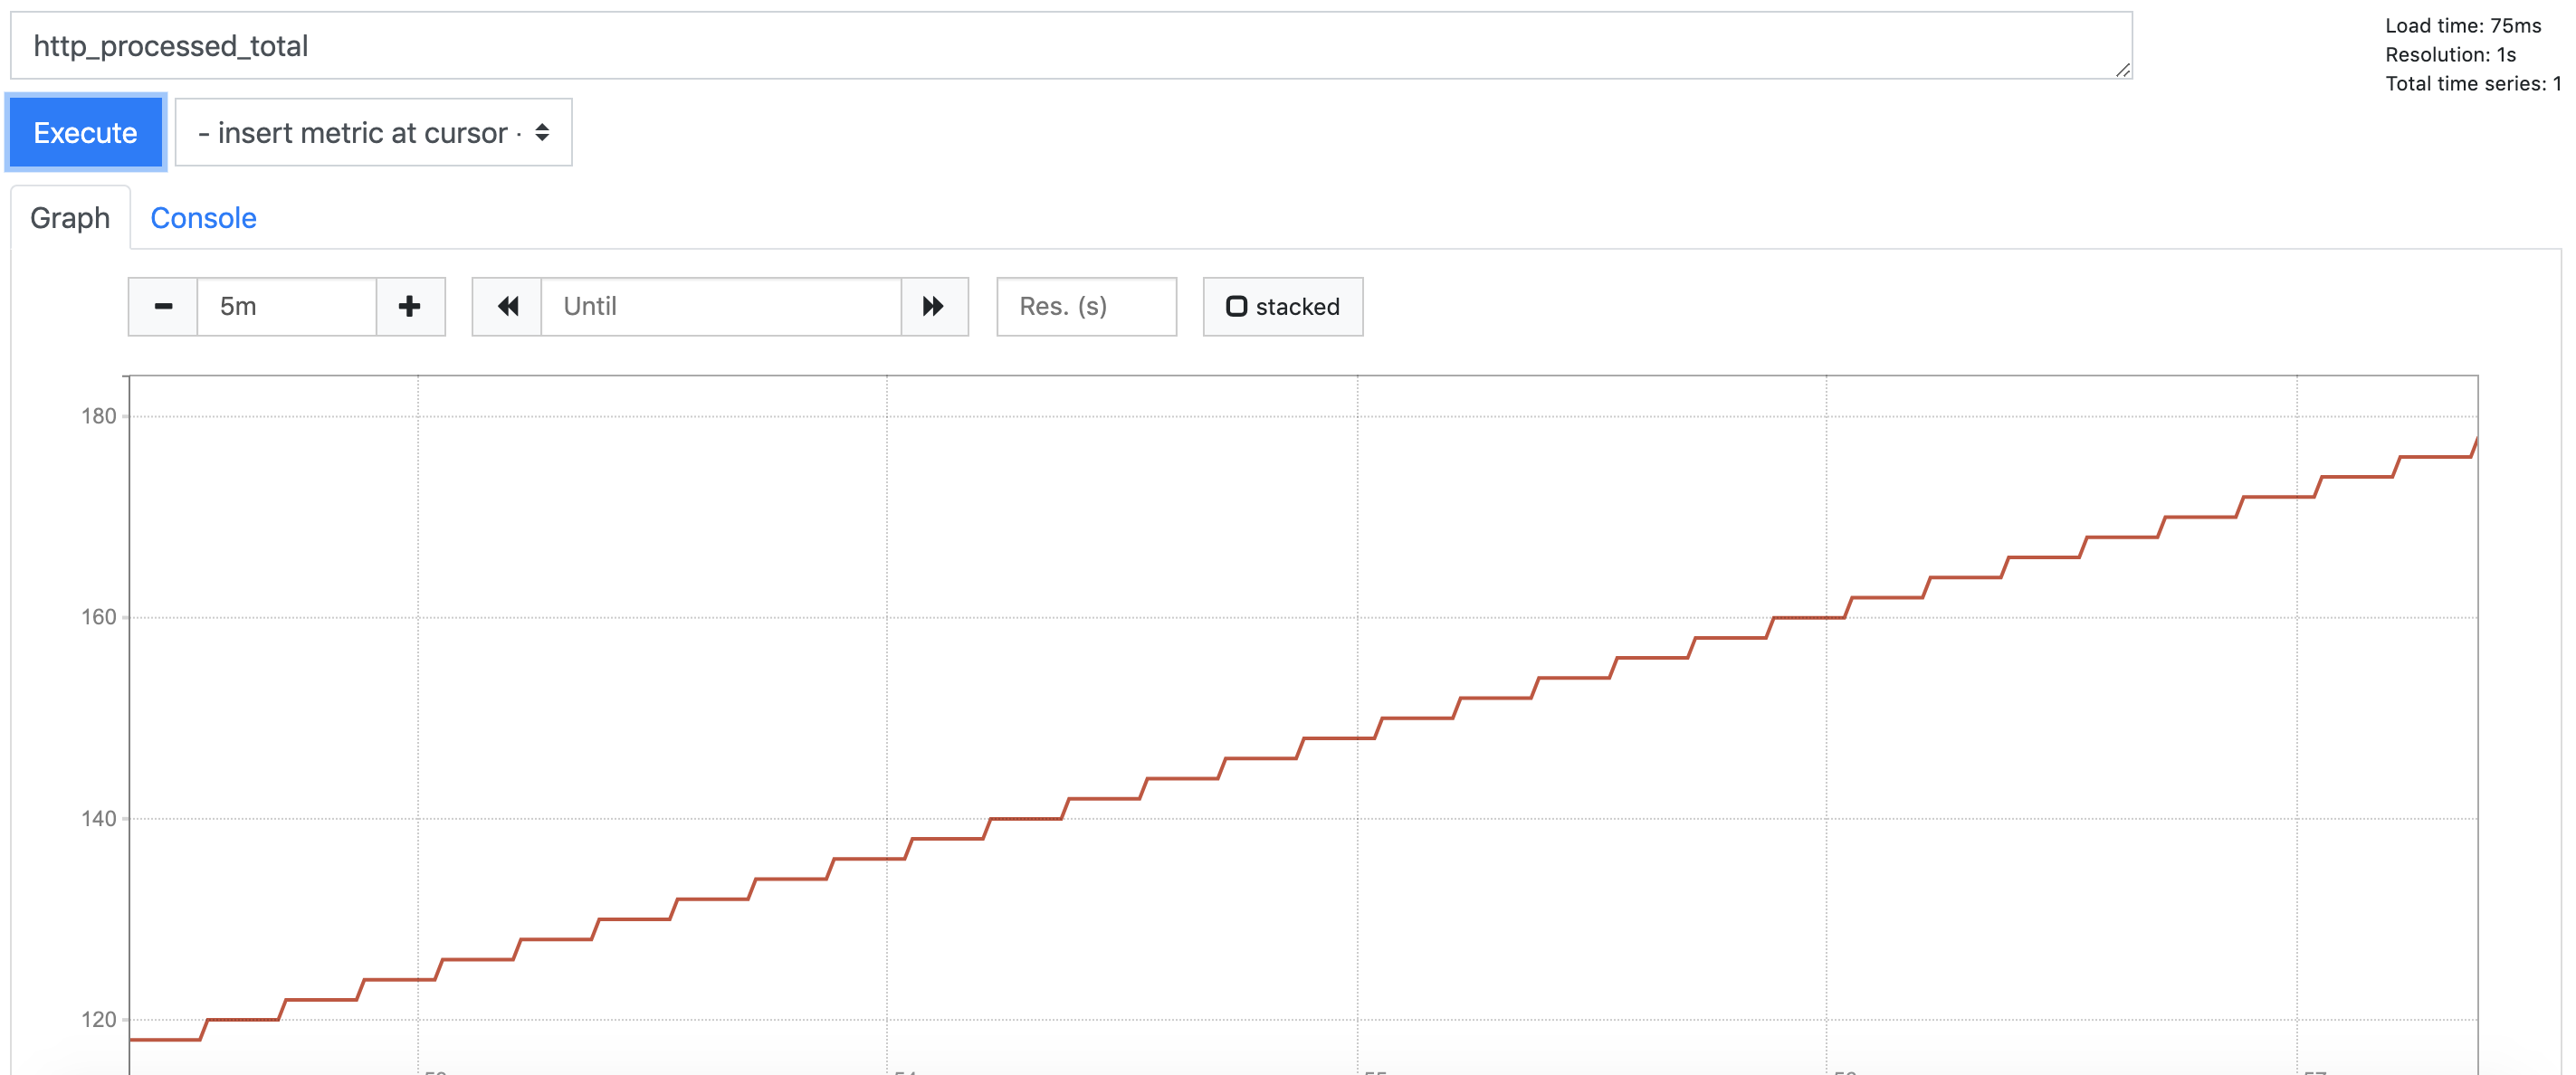
counter当前的值并不重要,重要的在一段时间内counter增长的量以及速率,也可以理解为增长趋势
increase
我们已经知道counter来说,更关注的是在一段时间中增长的量,那么如何获得这个量呢?其实很简单,例如我们想获得最近5分钟增长的量,只需要用counter当前的值减去5分钟前counter的值即可。
在prometheus中有专门的函数来计算这个值,也就是increase
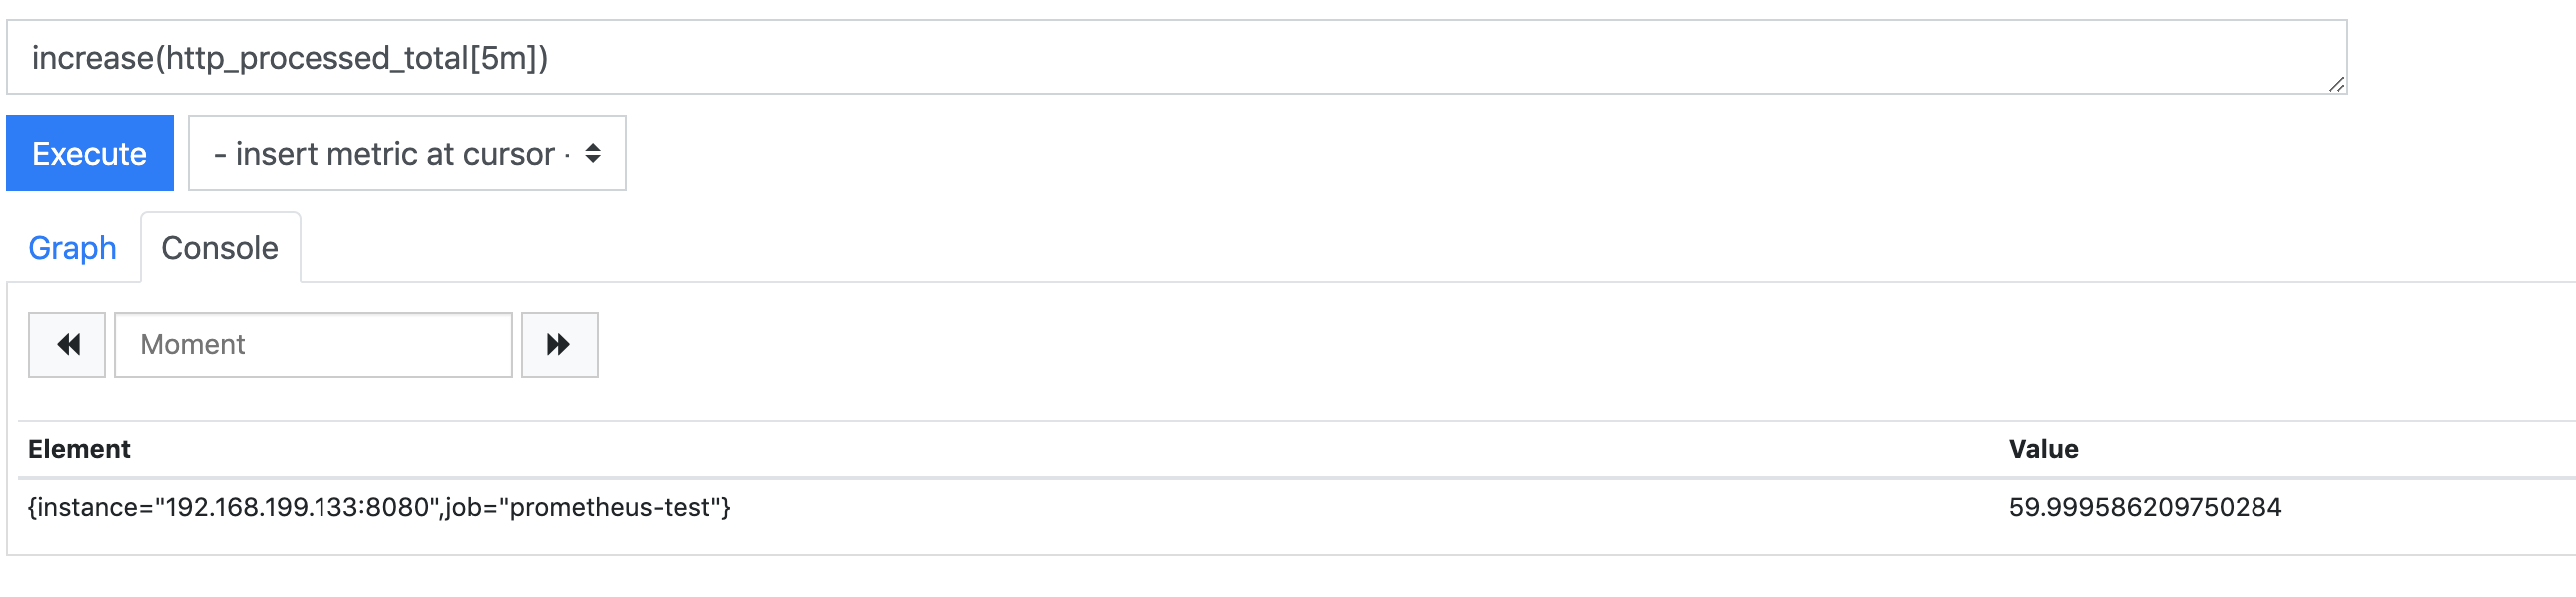
increate(http_processed_total[5m])
increase的具体用法可以参考prometheus 文档
执行上述的语句,我们得到的结果应该为60,因为我们是每隔5s对counter加1,5m内增长的量为5 * 60 /5 = 60, 但是实际上得到的并不是60。这是为什么呢?
根据之前prometheus.yml中配置可知,prometheus每隔10s采集一次,而demon中,counter每隔5s加1,所以对于prometheus采集的值来说是每次加2。假设prometheus从10:30:00开始抓取数据,此时counter的值假设为18,那么可以得到如下的数据
10:30:00   http_processed_total 18
10:30:10   http_processed_total 20
10:30:20   http_processed_total 22
...
10:34:50   http_processed_total 76
10:35:00   http_processed_total 78
10:35:10   http_processed_total 80
10:35:20   http_processed_total 82
如果我们在10:35:13查询最近5m的数据,可以得到
10:30:20   http_processed_total 22
...
10:34:50   http_processed_total 76
10:35:00   http_processed_total 78
10:35:10   http_processed_total 80
10:30:10的数据已经超过了5m中,所以取不到,因此value=(80-22)=58,但是实际上prometheus并不会返回这个值。因为increase函数会推缺失值并估计边界点的值,所以prometheus返回的值比我们预想的要更精确,但是却不是最终正确的值。

rate
Counter另一个值得关注的值是平均每秒增长的个数,例如在10:30:00 counter的值为10,在10:30:10 counter的值为20,那么平均每秒增长的值为(20 - 10)/10 = 1
prometheus提供了rate函数来计算这个值
rate(http_processed_total[5m])
上述表达式计算的过去5m中平均每秒处理的http请求,如果想知道每分钟处理的http请求数,只要乘以60即可
rate(http_processed_total[5m]) * 60
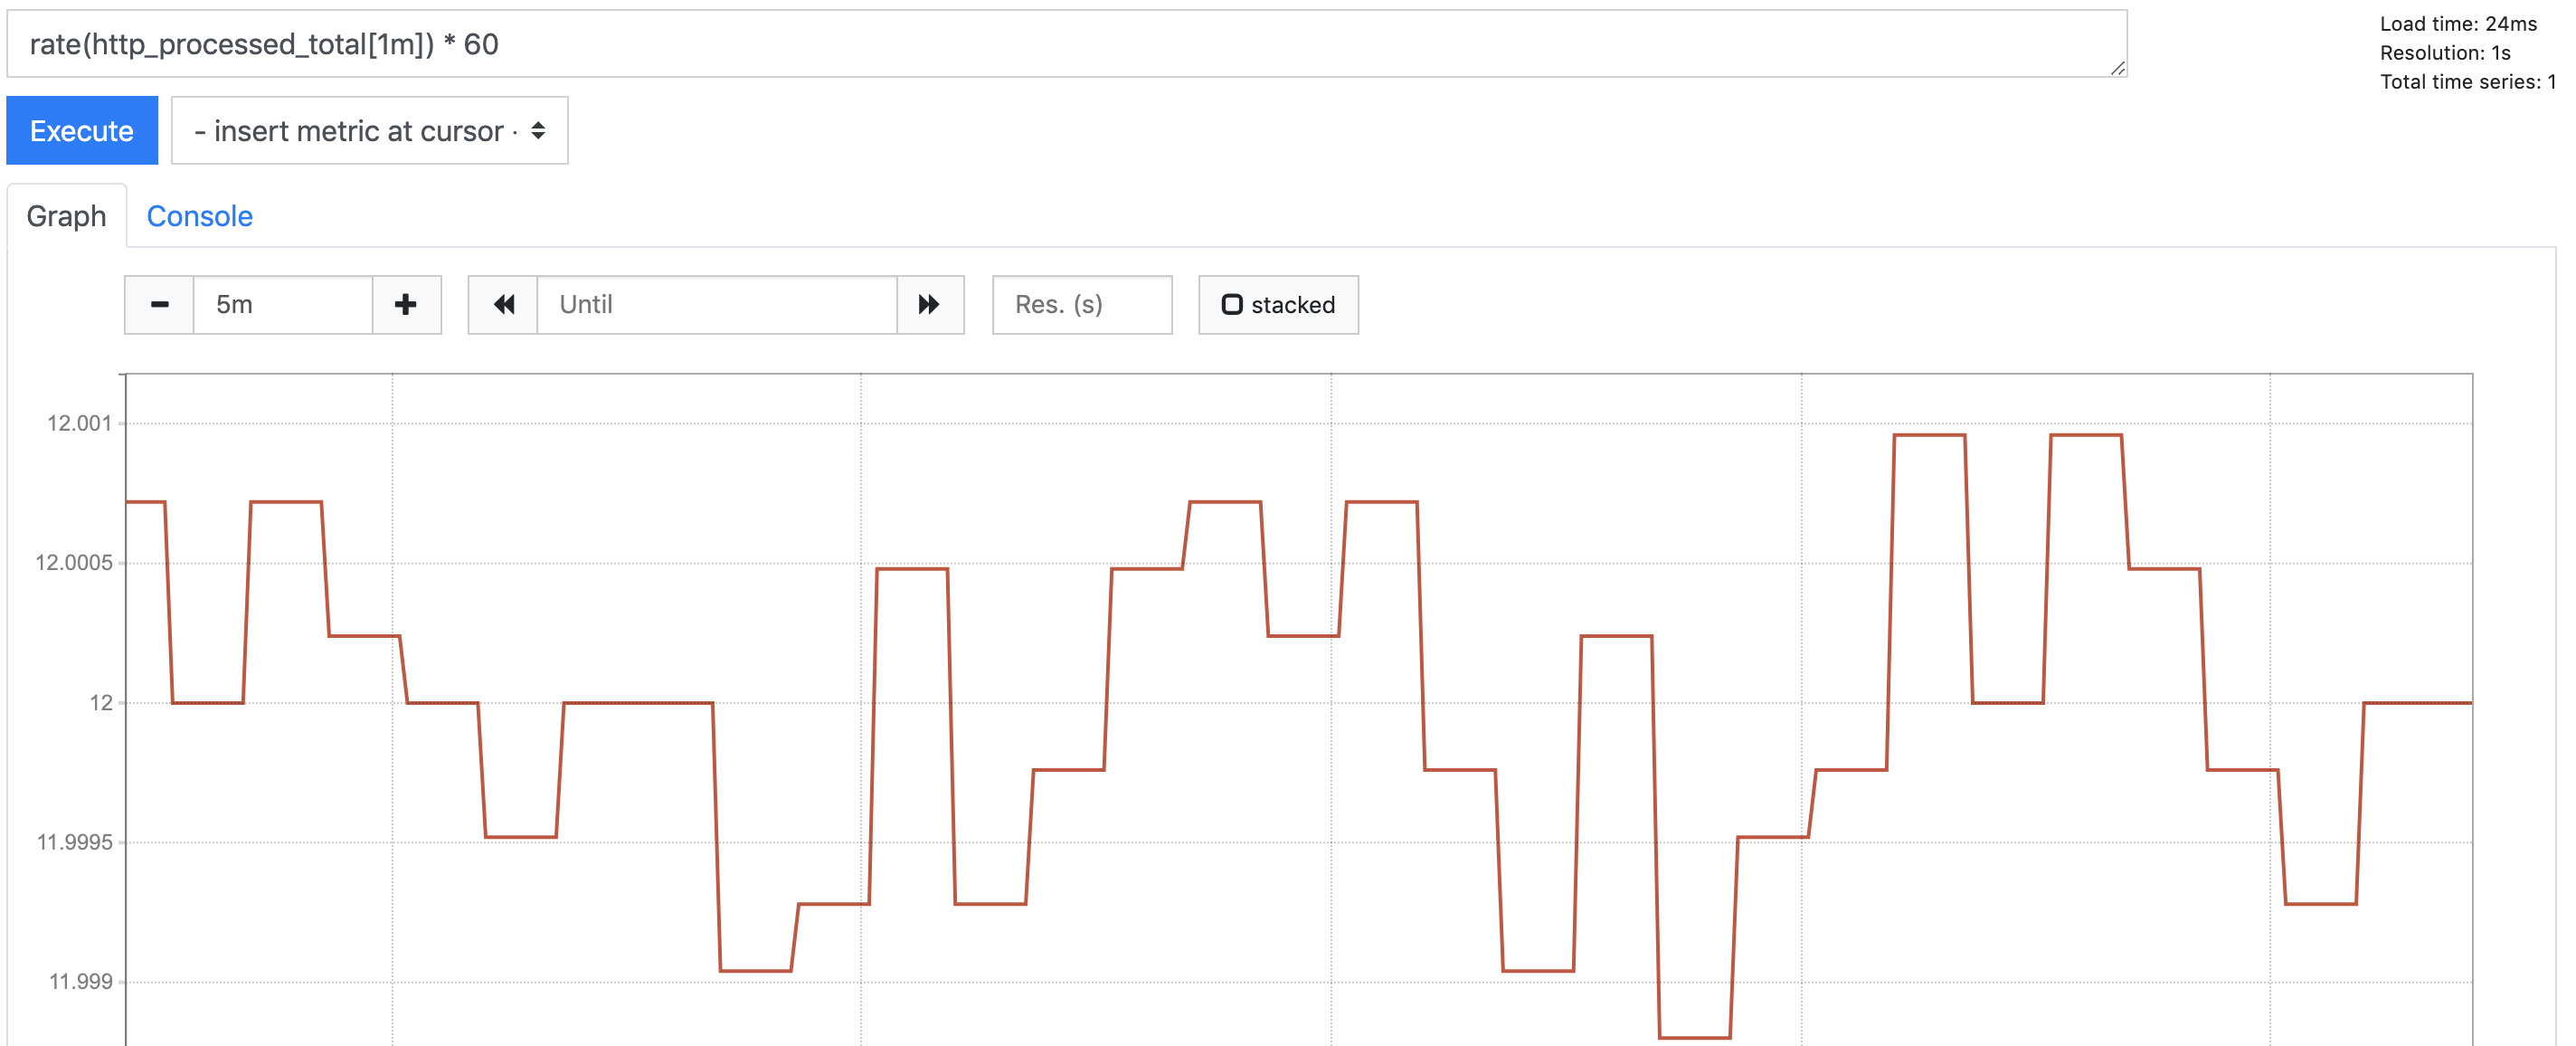
上图乍一看比较奇怪,因为数值在上下波动,其实是因为Y轴的粒度较细,如果我们将时间区间有5m调整到15m,则可以看到一条直线
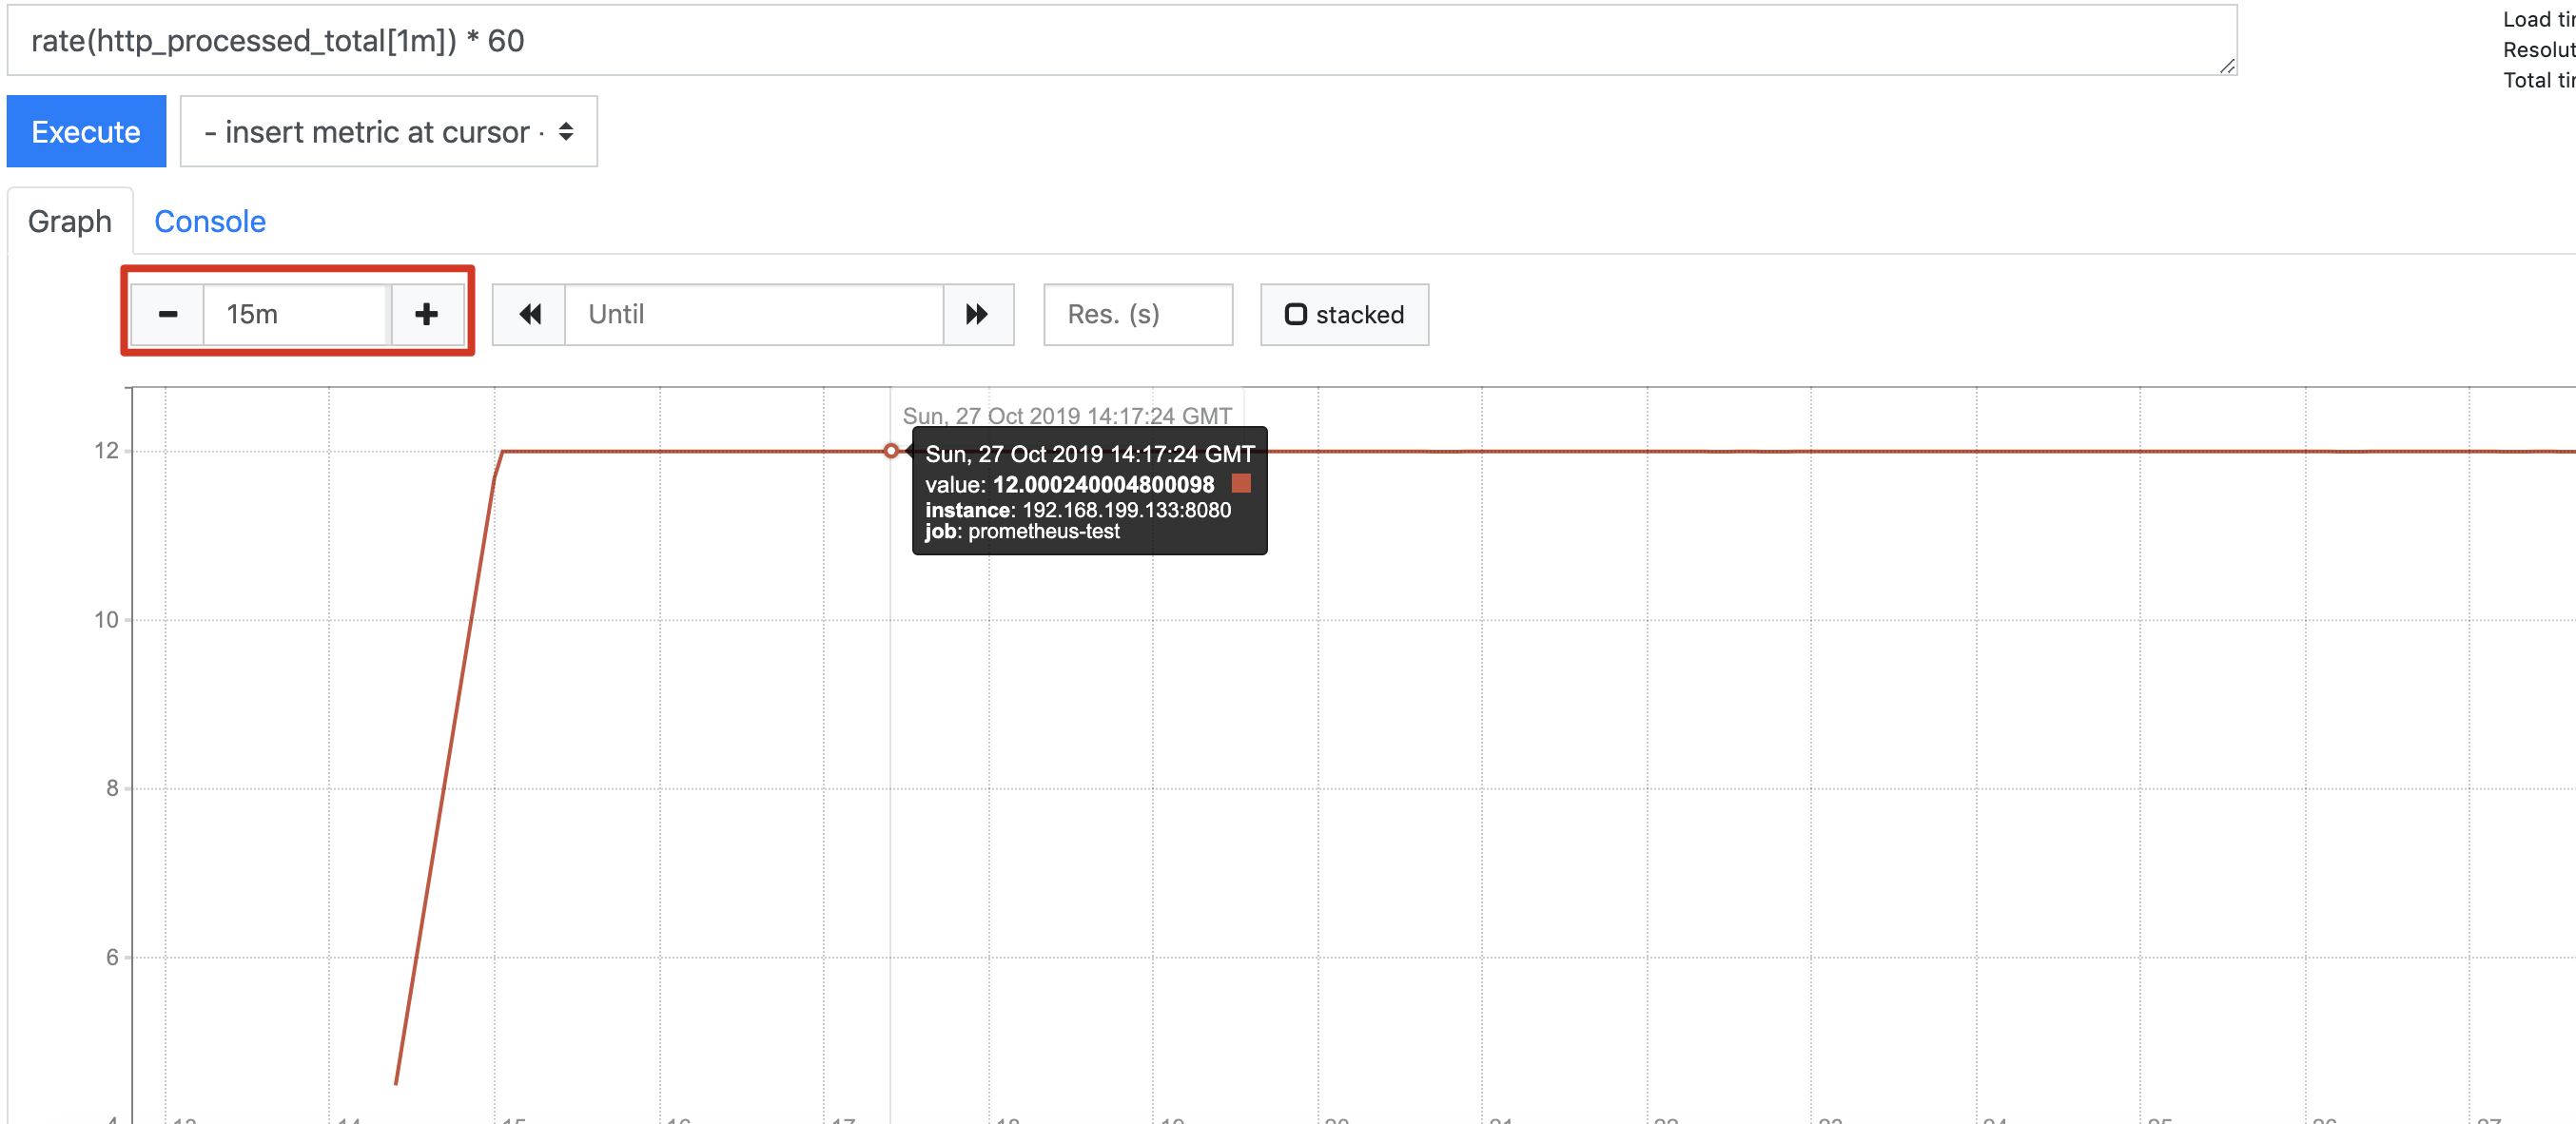
对于rate来说,如果当前时间为t,若计算过去5m的值,那么时间范围就为t - 5m。在上面曲线图中14:17分的值表示[14:16,14:17]这一段时间增长的值,因为range为1m
aggregation
上述示例的指标较为简单,但是在实际应用中,一个指标可能存在多个属性。在Micrometer称为tag,而在prometheus中则称为label。以http request为例,一个request我们会关注它的返回code,它的method。我们创建一个名为http.request的metric,它有code和method两个tag
@Autowired
private MeterRegistry meterRegistry;

private List<String> methods = Arrays.asList("GET","POST");
private List<Integer> codes = Arrays.asList(200,204,404,500);

@Scheduled(fixedDelay = 5000)
public void httpRequest(){
    meterRegistry.counter("http.request",
            "method",getMethod(),
            "code",String.valueOf(getCode())).increment();

}

private String getMethod(){
    return methods.get(ThreadLocalRandom.current().nextInt(methods.size()));
}

private int getCode(){
    return codes.get(ThreadLocalRandom.current().nextInt(codes.size()));
}
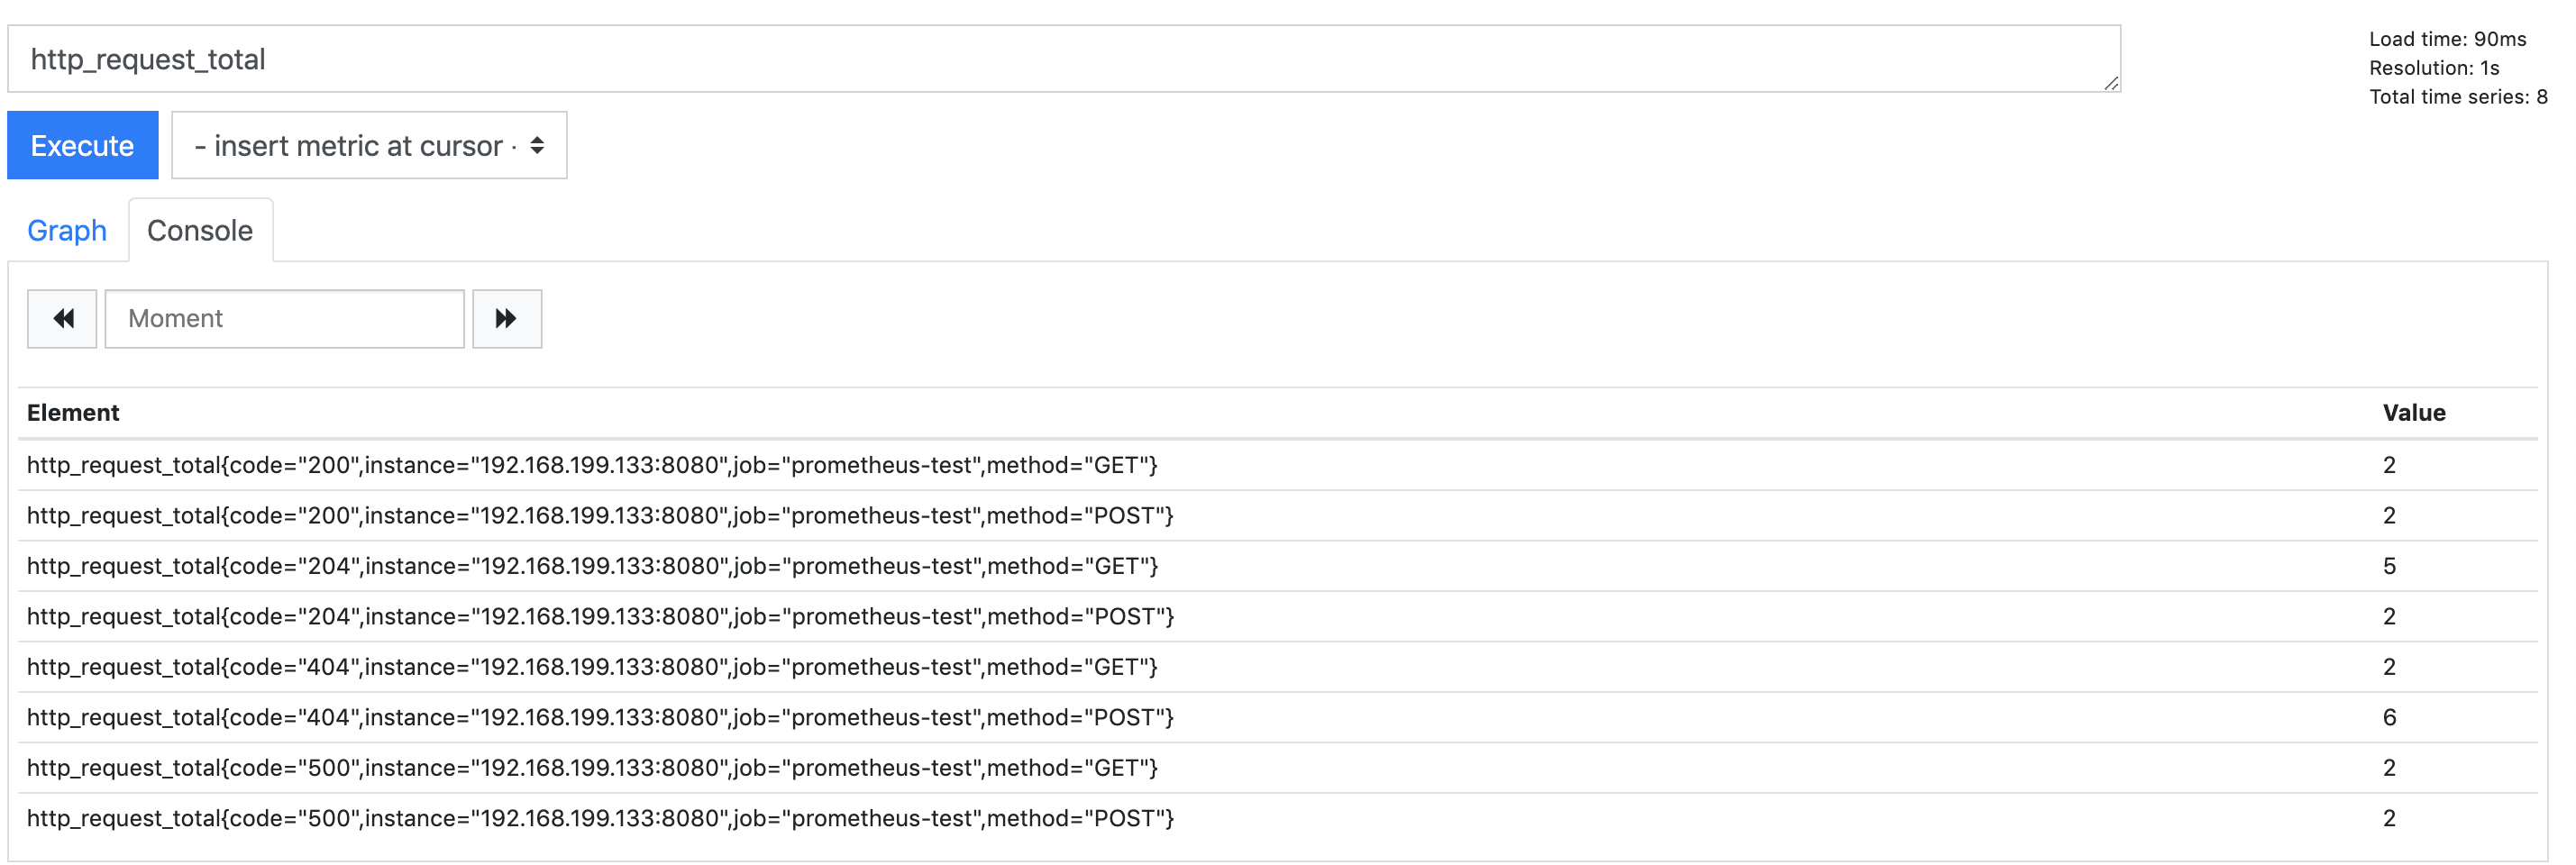
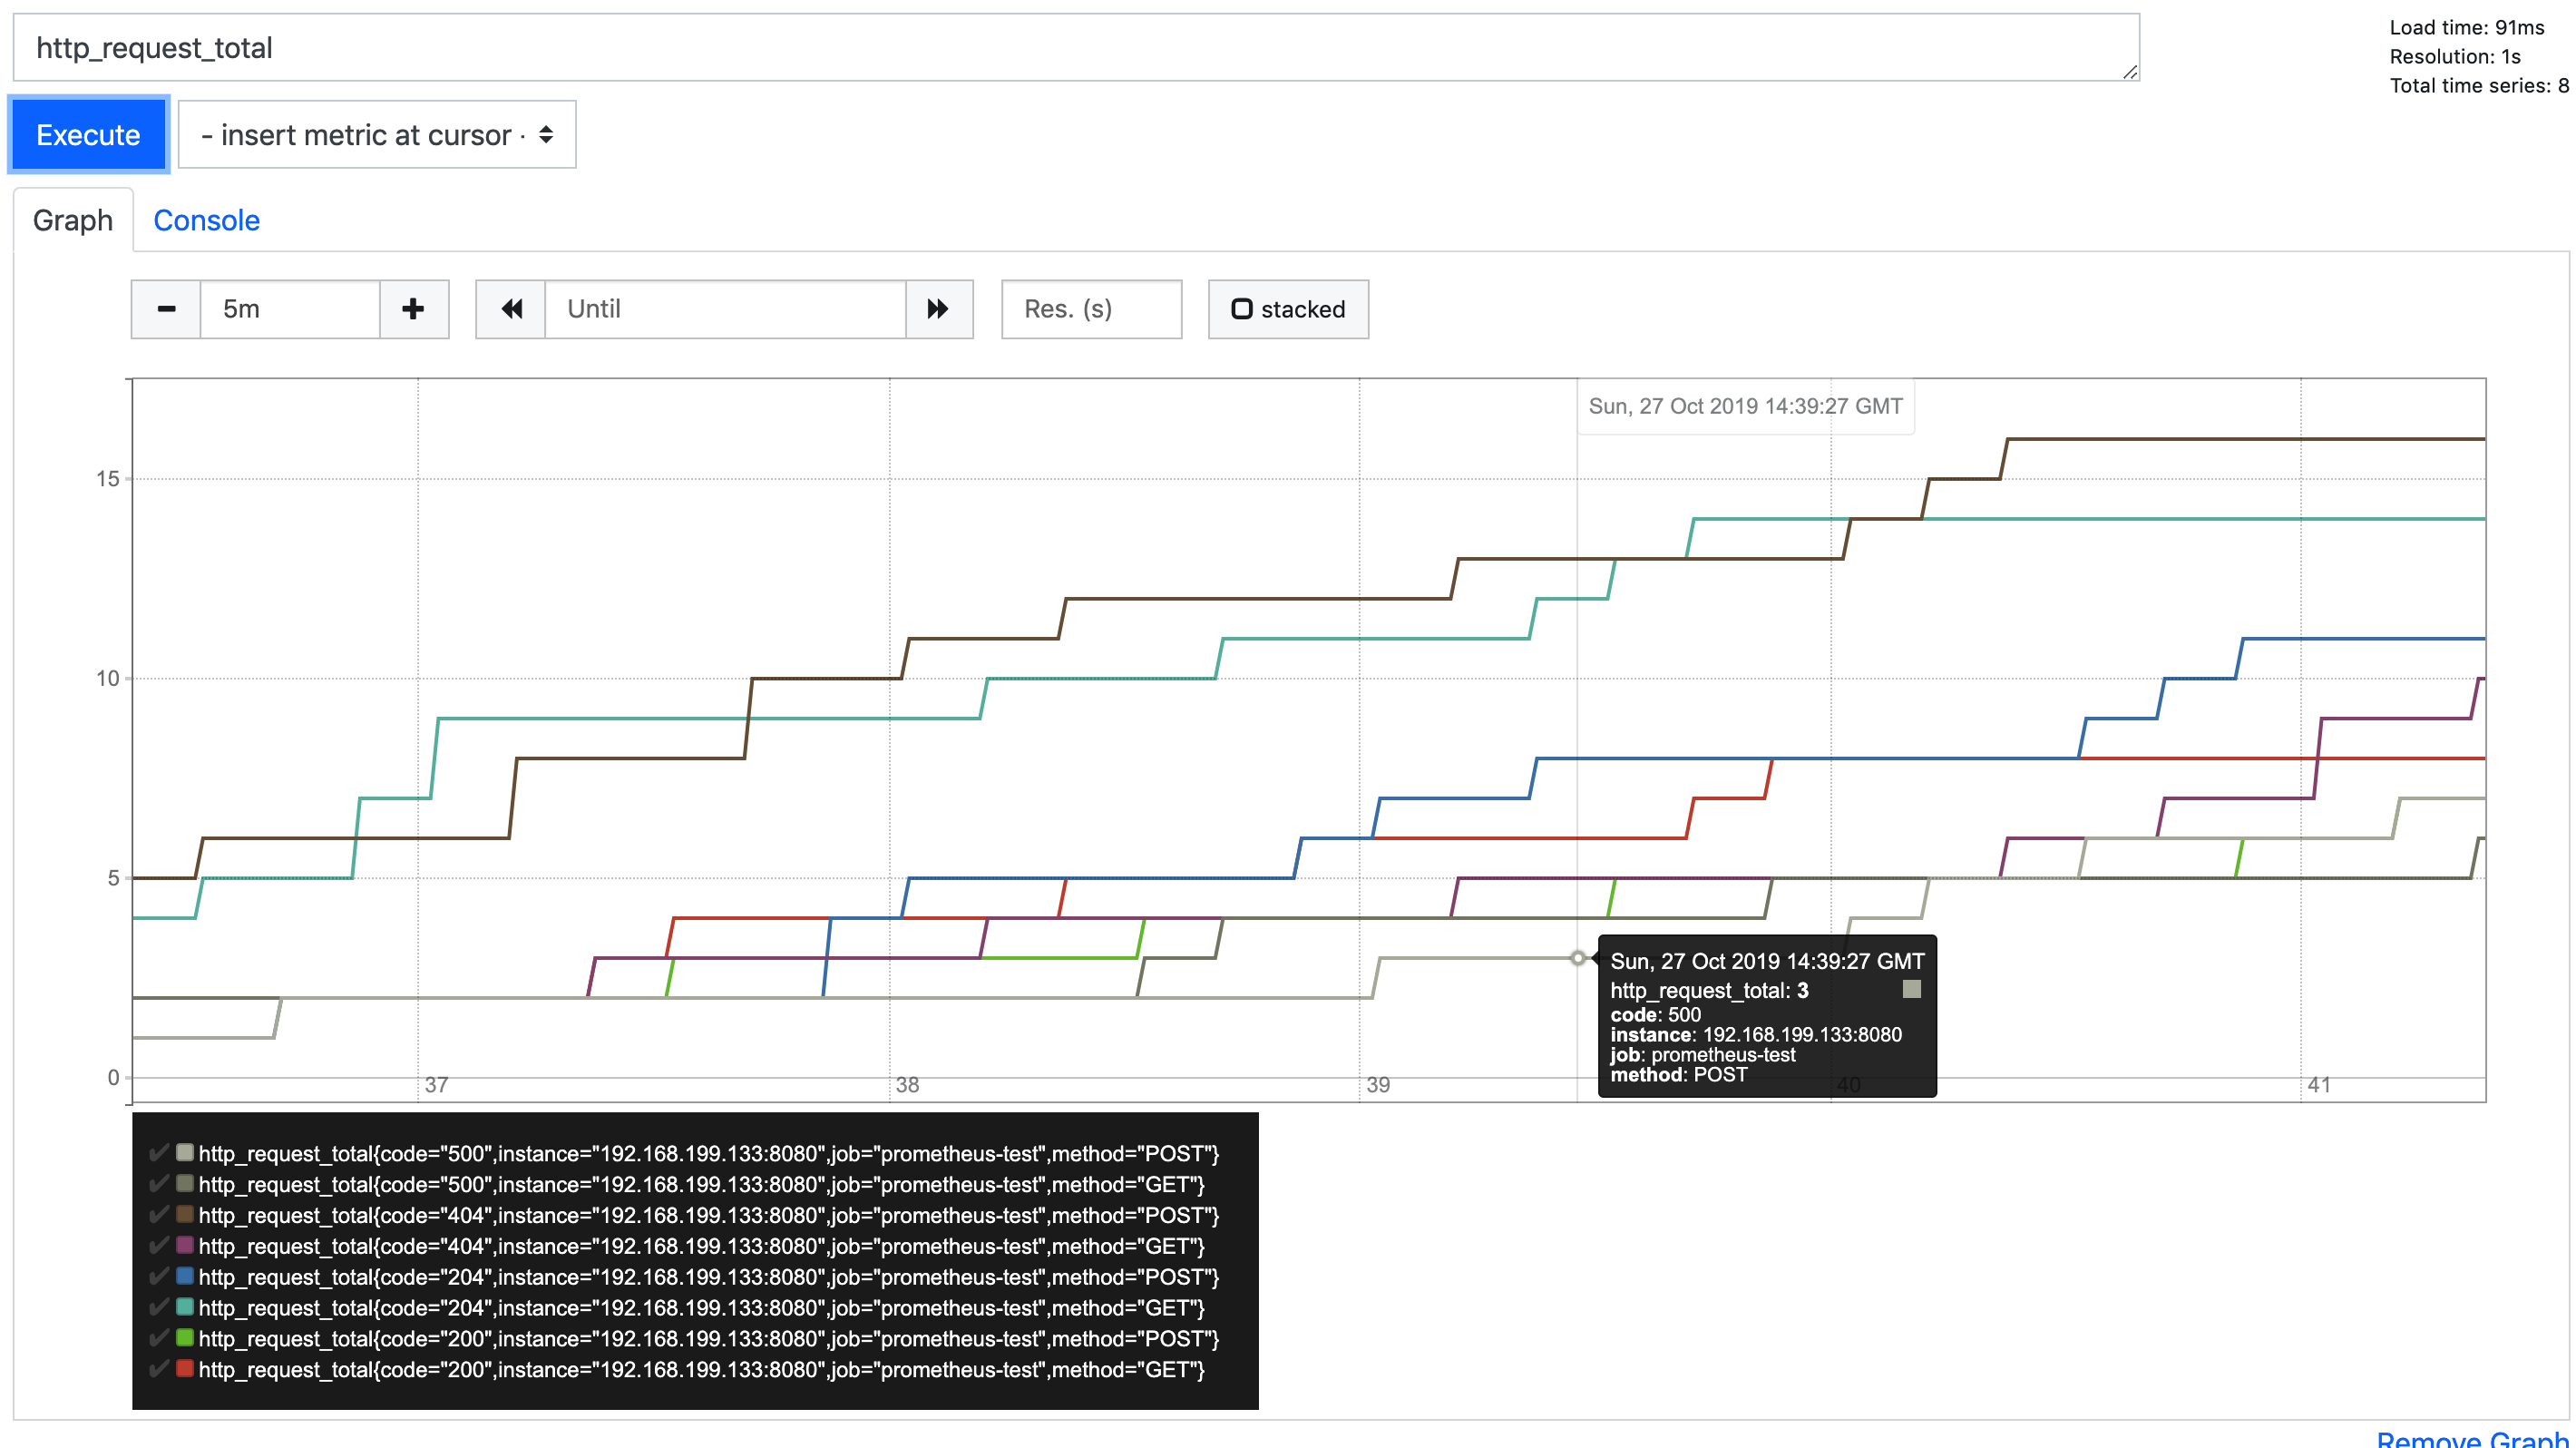
我们之所以可以看到多条查询结果,是因为prometheus为每一个label之间的组合都创建了一个vector,在结合时间,就成了一个时间序列(time series),在Graph中我们可以看到多条曲线
prometheus允许我们根据label来过滤不同的metric,例如
http_request_total{code="200"}
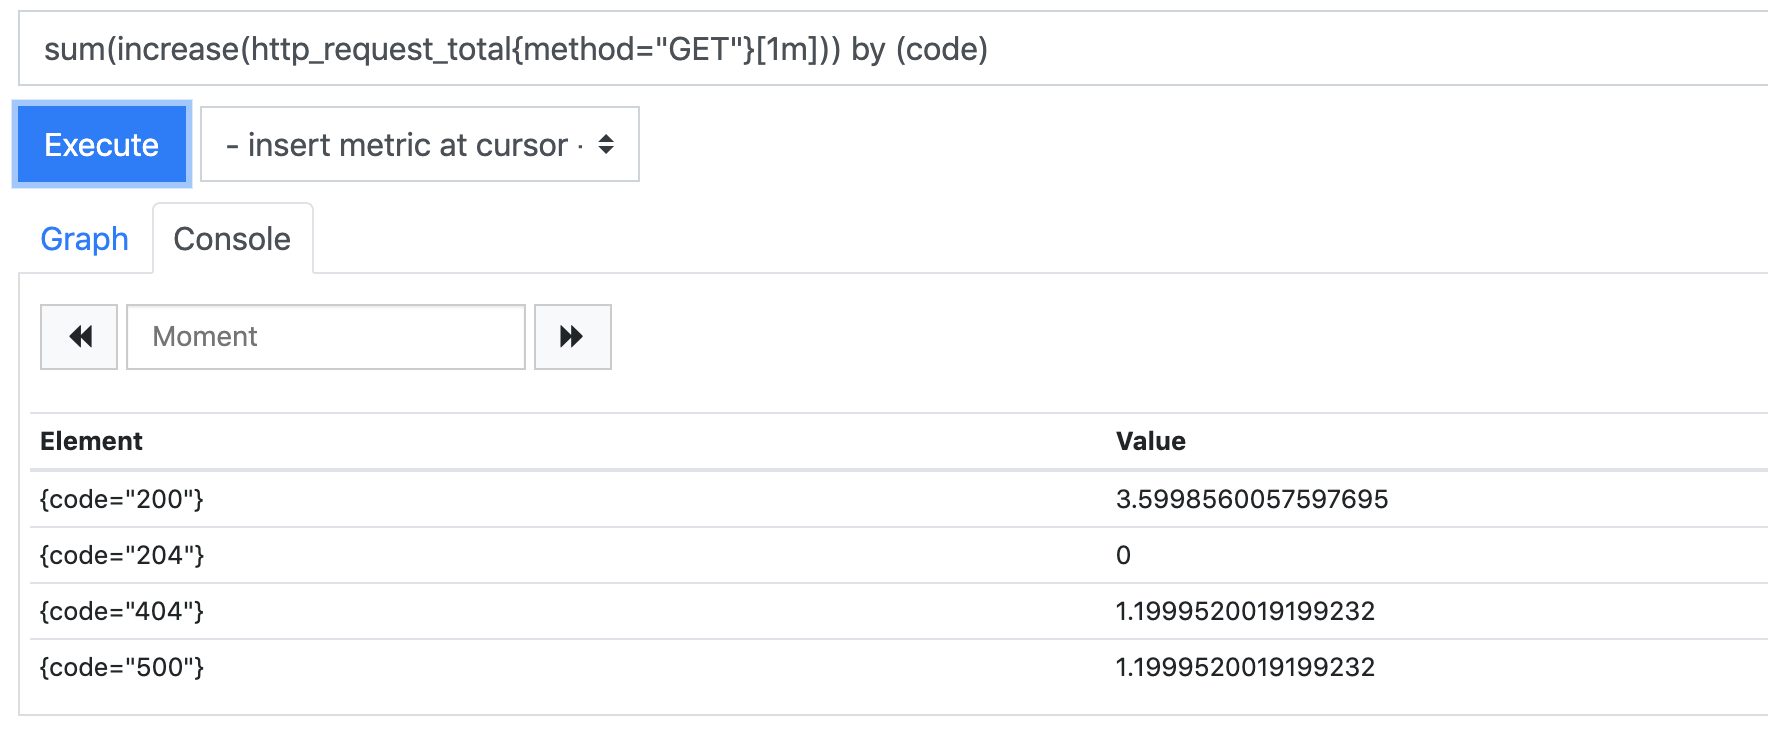
同时prometheus提供了相应的聚合函数,帮助我们对相同label的metric进行聚合操作,例如
sum(increase(http_request_total{method="GET"})) by (code)
总结
在第一印象中,我们总是认为Counter是prometheus最简单的一个metric,但实际上它使用起来比想象中要来的复杂。关于Counter我们要记住以下几点
- Counter的当前值意义不大,我们更关注的是Counter在一段时间内增长的数量以及速率
- increase函数可以计算一段时间内增长的值,但是它会对时间边界的值进行估计,因此得到的是一个近似值
- rate函数可以计算一段时间内增长的平均速率